All you NEED to Know about Slippage, News trading & the Ask/Bid Charts at RebelsFunding
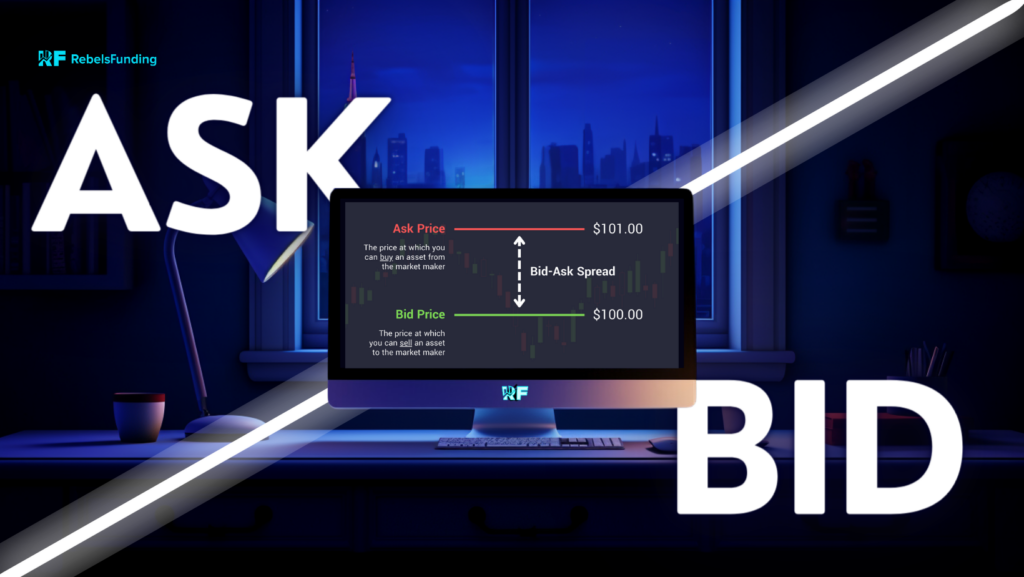
At RebelsFunding, some of the most frequent questions we get in our community from new members often revolve around slippage, news trading and how to navigate the RF Trader platform (to understand the difference between Bid and Ask prices/charts, and also view Spread history).
In today’s blog post, we will answer and address all of your questions regarding slippage, spread, news trading and the difference between bid/ask prices:
1. Can I trade news at RebelsFunding? Is news trading allowed?
Answer: Yes, you can trade news at RebelsFunding. Yes, news trading is allowed. But we do not recommend it to everyone (especially amateur traders), unless you know you are very equipped for it; meaning you are fully aware of the risks involved and have an effective risk management in place.
2. What are the risks involved in news trading? What are the disadvantages of news trading?
Answer: One of the cons of news trading we would like to point out is that it can cause unexpected negative gabs or slippage.
If the market goes against you, you can lose way more than what you expected. Your stop loss can be “jumped” or “kicked out.”
With news trading, you can easily breach or violate your drawdown limit.
So it is safe to avoid news trading or trading during high volatility.
3. Do you have slippage at RebelsFunding?
Answer: Firstly, you must understand that slippage is a normal occurrence in forex trading. It is mostly caused by high volatility, low liquidity, order size, etc.
It can work for you and make you more profitable than you expected. It can also work against you, making you lose more than you expected.
We have no power or control over slippage.
So, yes, you can experience slippage when trading at RebelsFunding: “natural” slippage.
Now, let’s move onto the bid/ask chart and spread on the RF-Trader platform:
On the RF-Trader, you can find both the Ask chart and the Bid chart. This is a unique feature on our trading platform that cannot be found on most platforms or brokers.
Because we are committed to being transparent, we provide you with these two charts so you can be in charge and make calculated trading decisions.
In the next questions, we will explain the function of each chart and how you can navigate them on the RF-Trader:
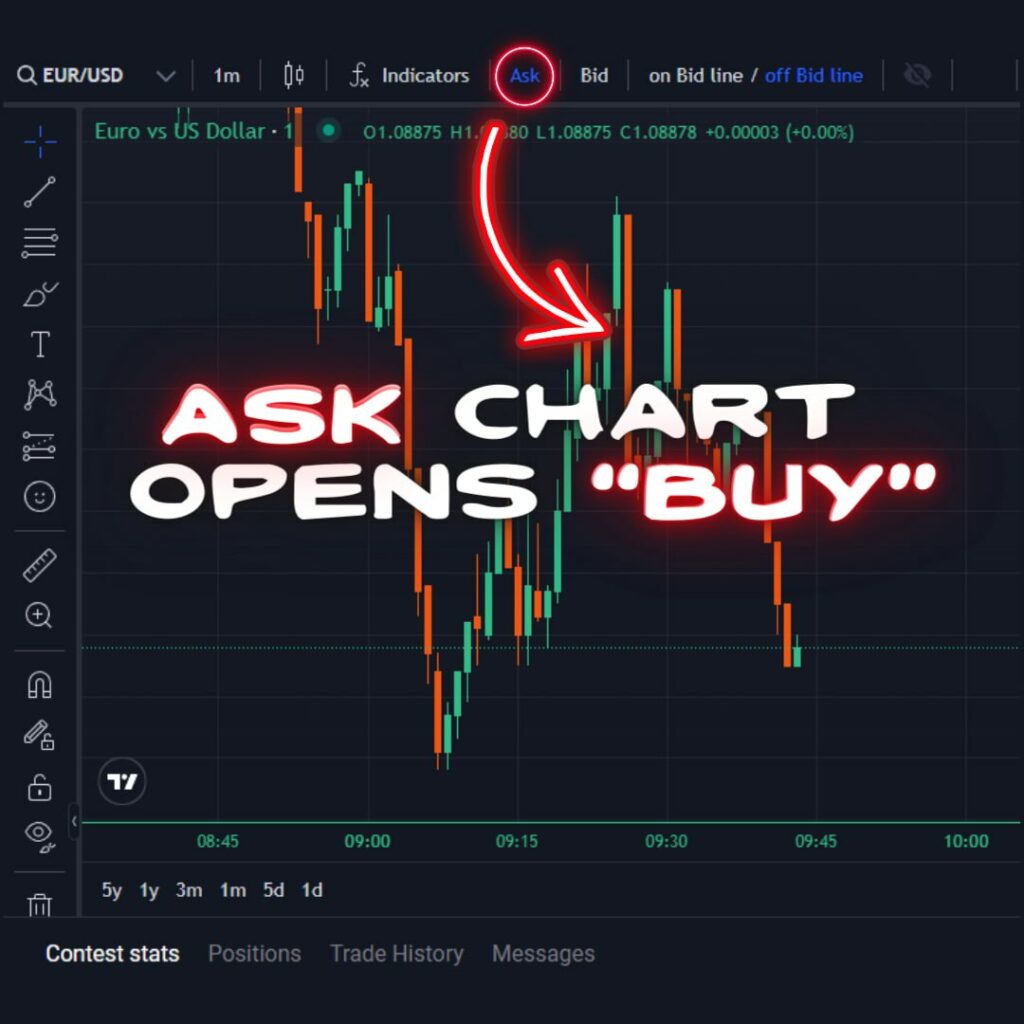
4. What is Ask chart? How can I view the Ask chart on the RF-Trader?
Answer: If you want to buy, the ask chart opens a buy transaction.
The ask chart is not common on most trading platforms, it is used by a few brokers such as OANDA, Saxobank, etc.
To view the Ask chart on the RF-Trader, follow the direction in the photo below:
5. What is Bid chart? How can I view the Bid chart on the RF-Trader?
Answer: If you want to sell, the bid chart opens a sell transaction.
It is what is widely used by most trading platforms. 90% of retail brokers use the bid chart. It’s also what most traders are familiar with.
It can help you to easily spot trends, patterns, and signals such as support and resistance levels, breakouts, and reversals.
To view the Bid chart on the RF-Trader, follow the direction in the photo below:
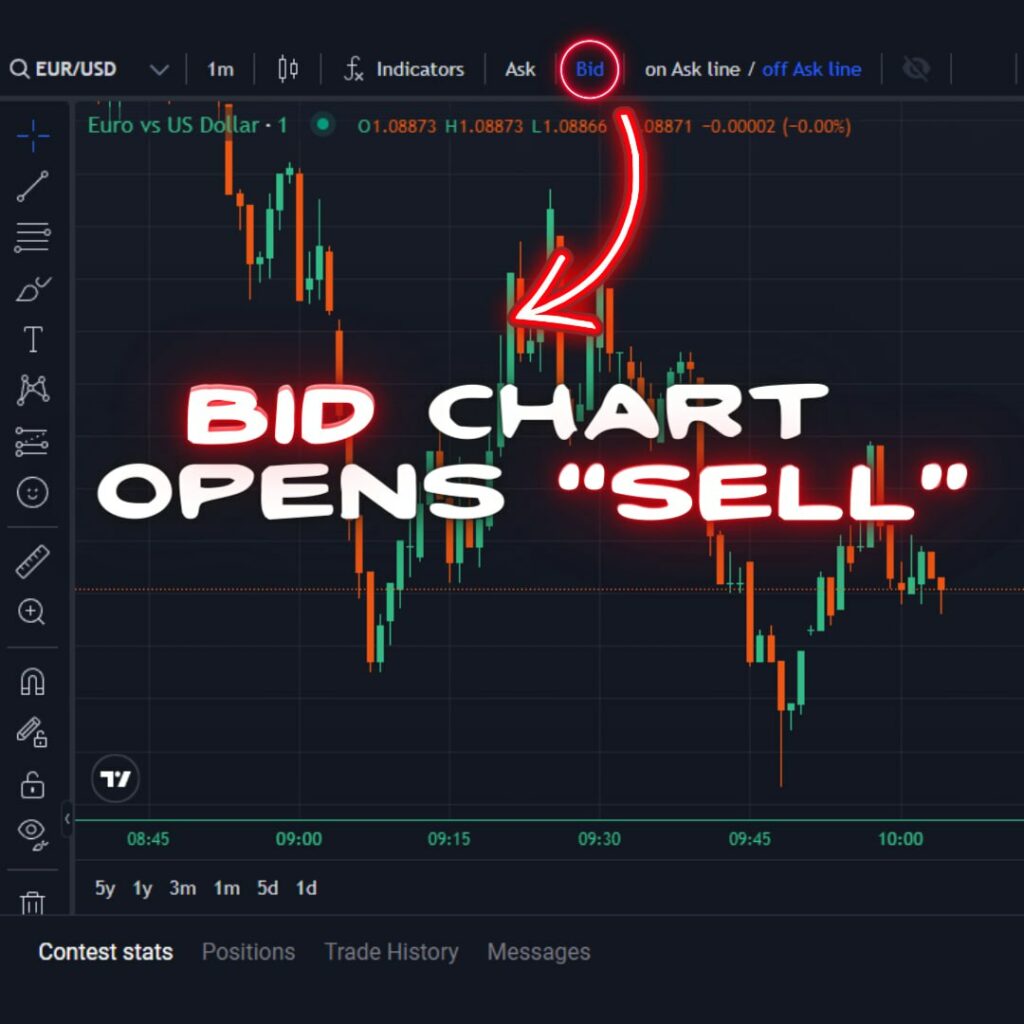
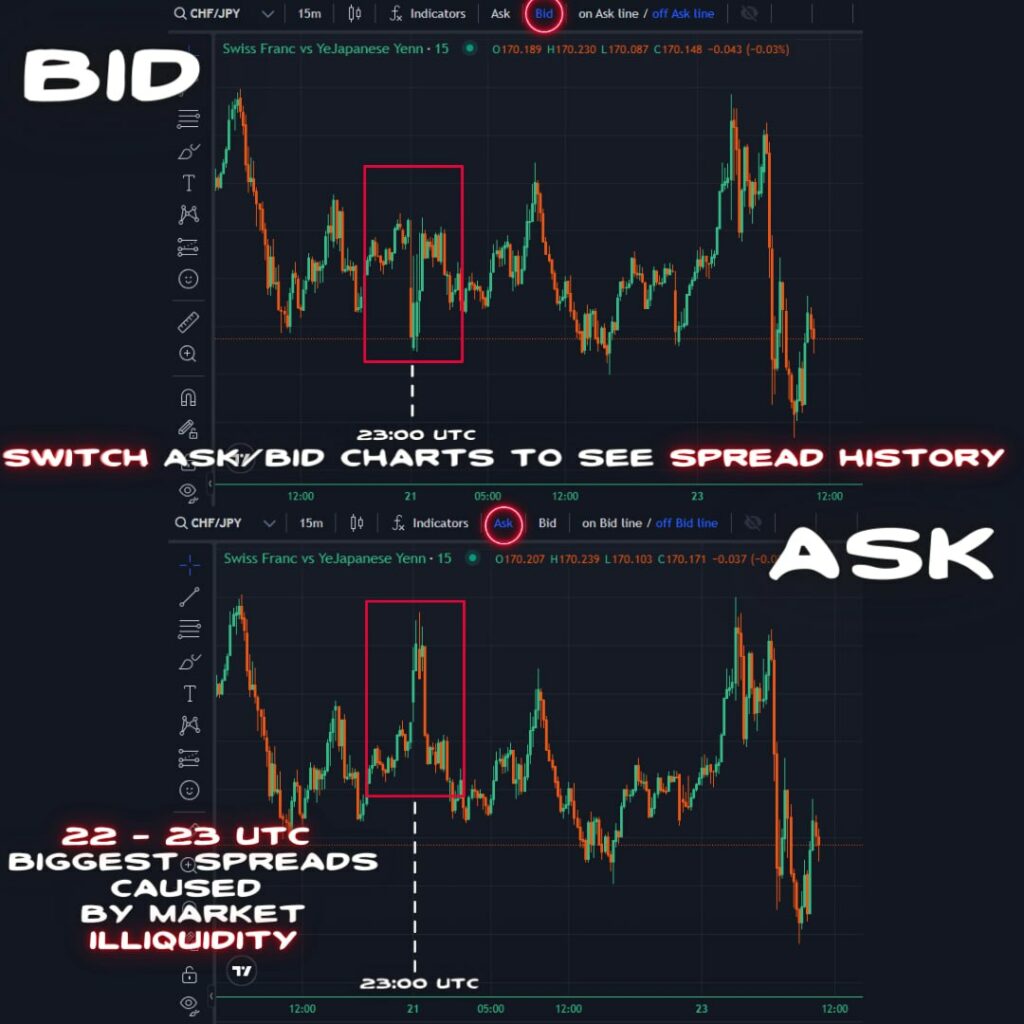
Switching between the Ask/Bid chart will allow you to view the history of spreads, help you identify instances of illiquidity.
6. What is Spread? How do I check Spread on the RF-Trader platform?
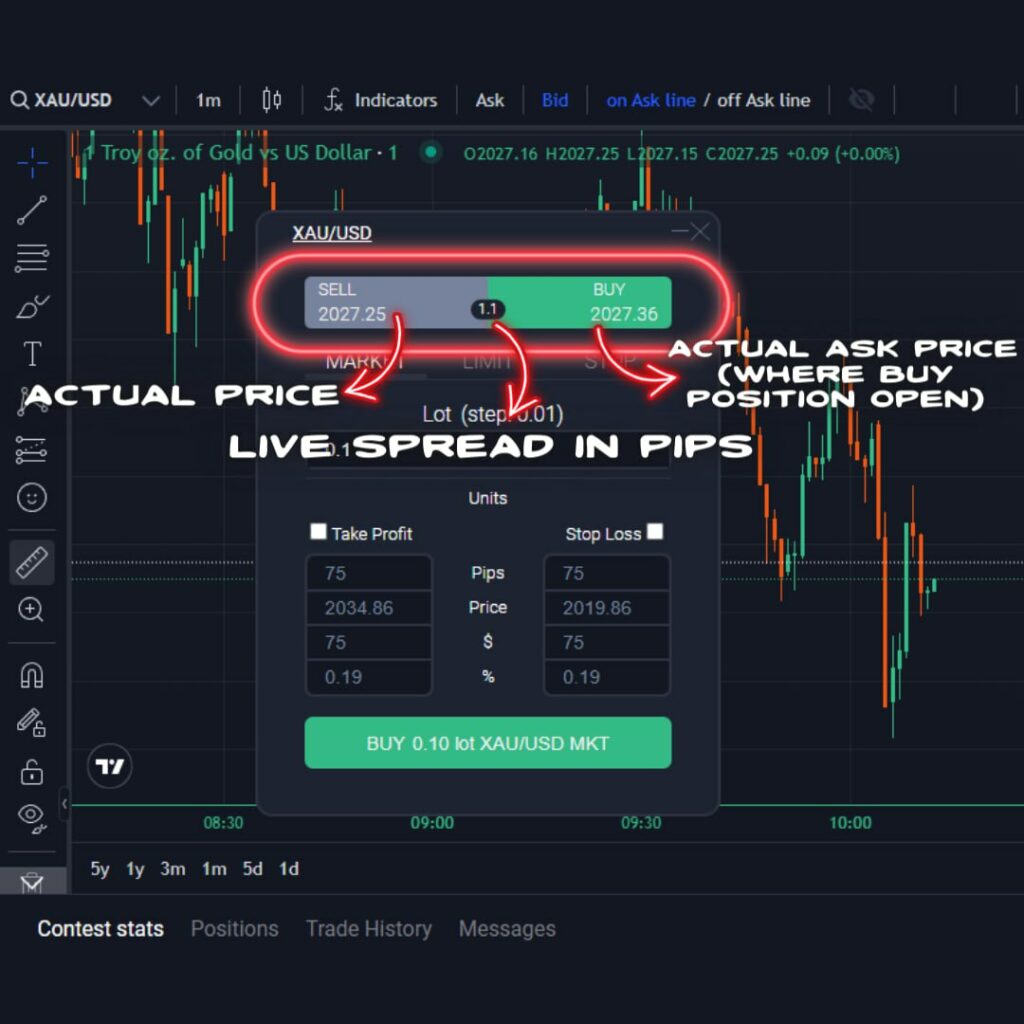
Answer: Spread is the difference between the ask price (the best available buying price) and bid price (the best available selling price) for a given financial instrument. It represents the trading costs and the closest limit orders in the market. It’s essentially the broker’s commission or fee for facilitating the trade.
To view spread history, simply switch between the Ask/Bid chart.
See photo below:
Let’s carry out a trade example to see how the Ask/Bid chart works on the RF-Trader:
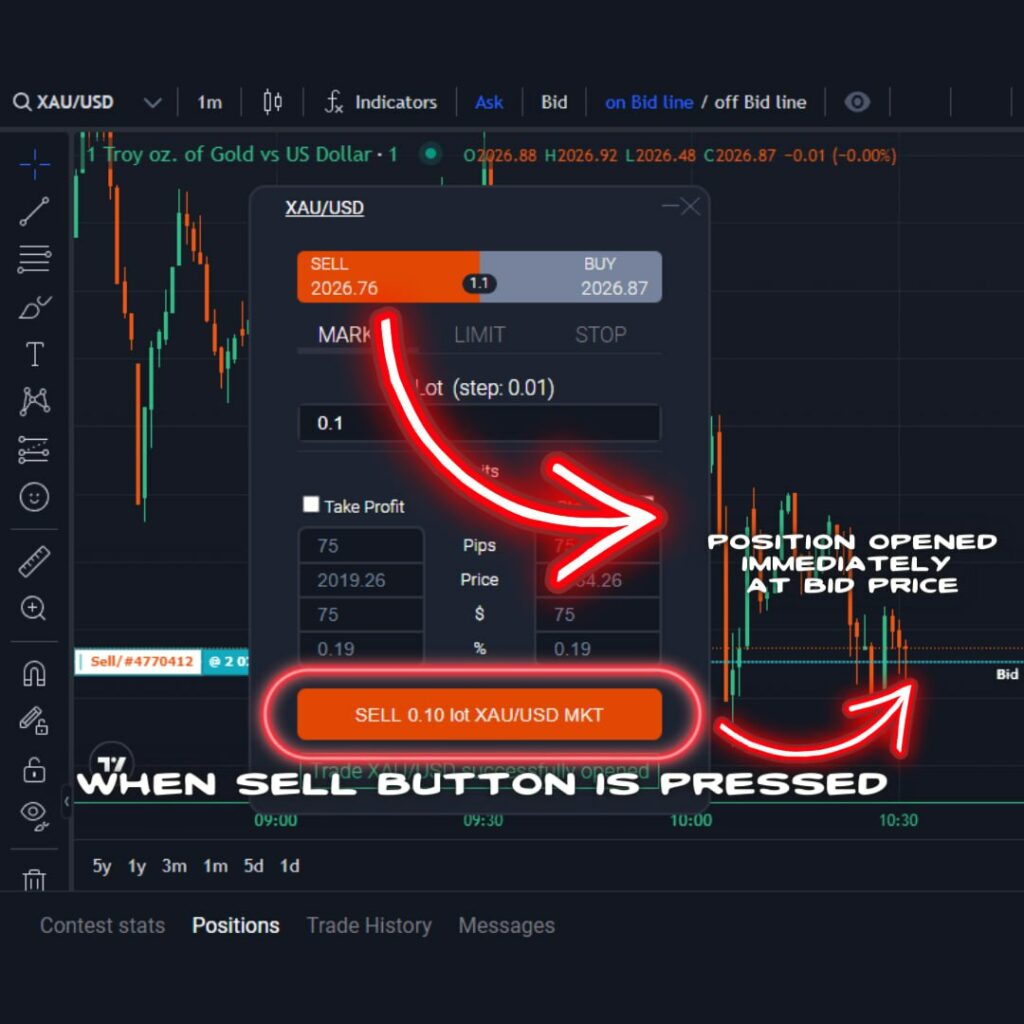
Let’s open a Gold sell: Firstly, we have to choose the Bid chart or If you have the Ask chart already displayed, you can turn on the Bid line on the platform.
Next, we open the SELL transaction.
When this is done, you would notice that the transaction is opened exactly on the actual bid price. The trade opens exactly at the intended price.
Pay attention to the chart, the line and your order.
See photo illustration:
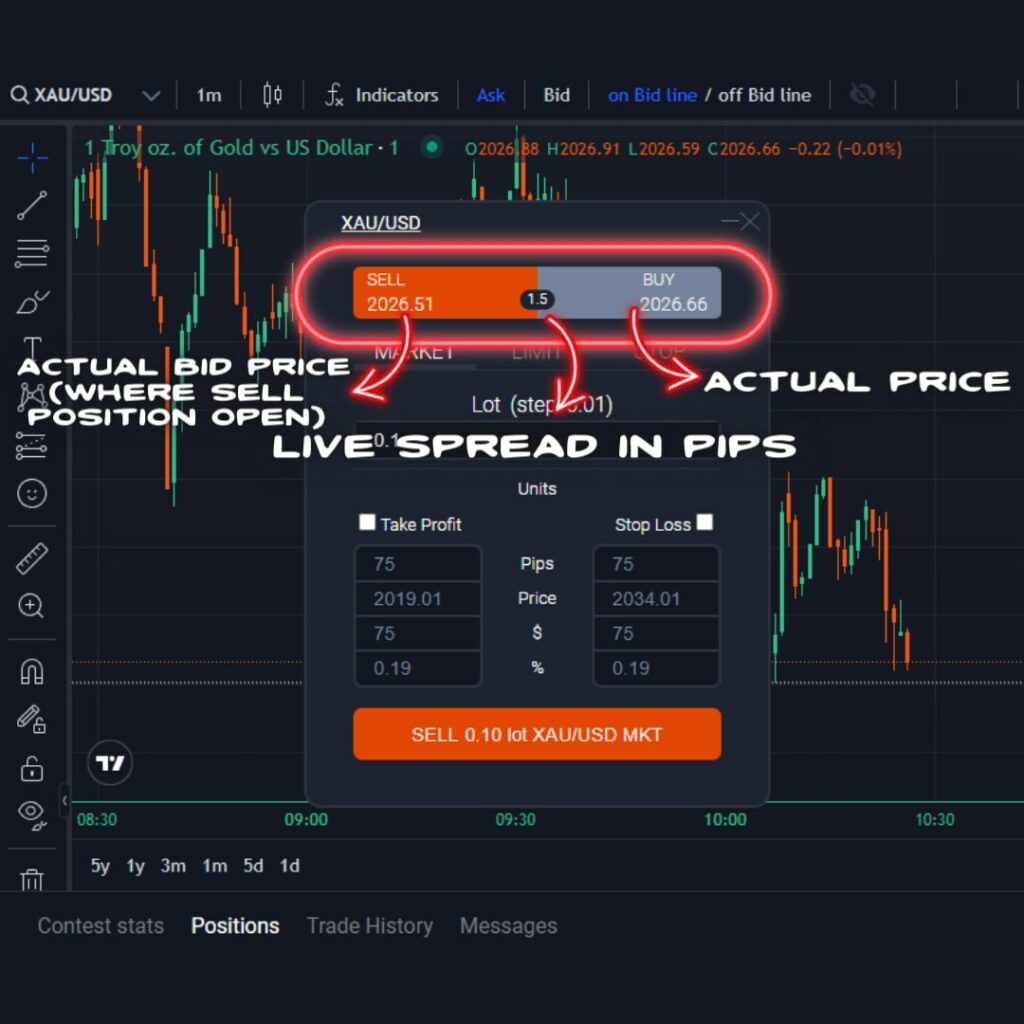
Now, if we want to close the sell transaction, we need to know that the sell transaction is closed at the ask price. This means we need to switch to the ask chart or enable the ask option to see the ask line and close the transaction.
And the transaction would be closed exactly at the price.
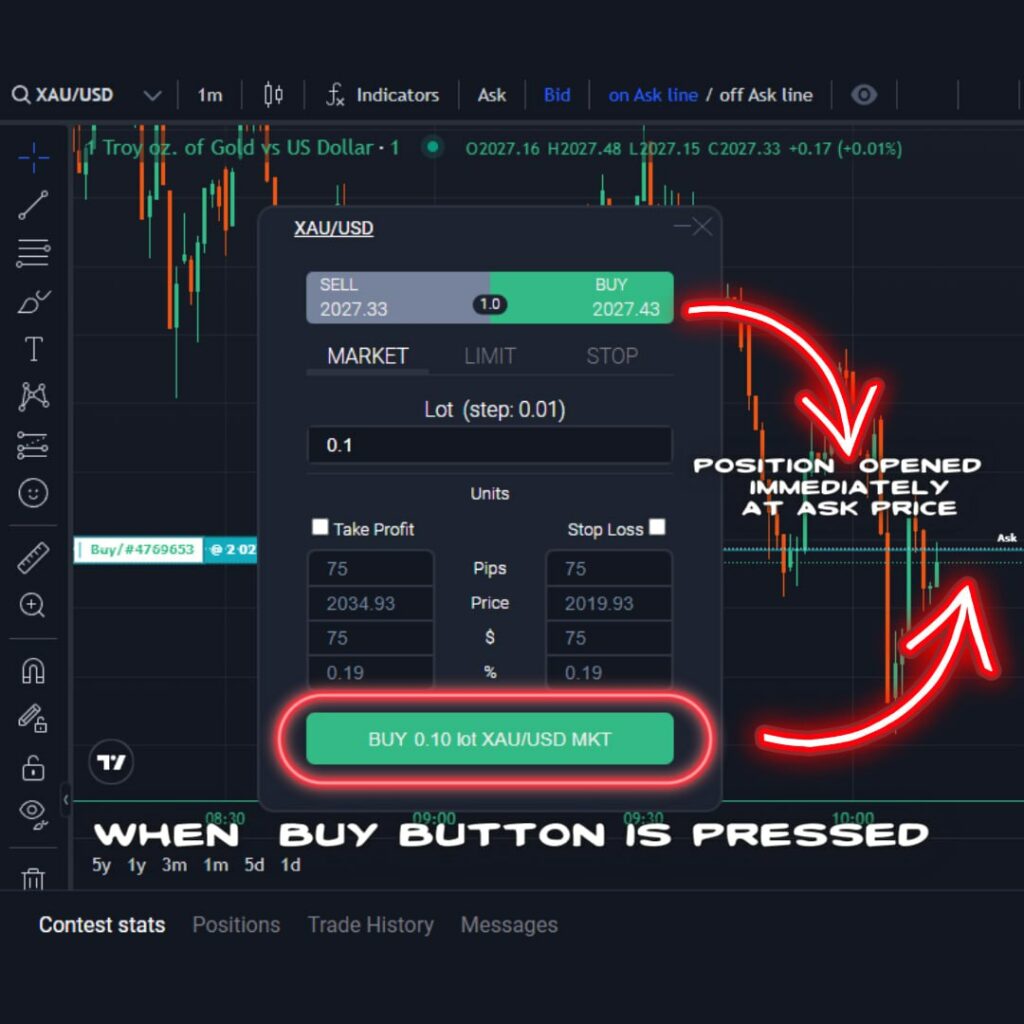
Also, if you were to inquire about a buy transaction, it works exactly the same way, but in the opposite direction. This means that the ask price opens a buy transaction, and the bid price closes it (These rules also apply to pending transactions).
See photo example:
Let’s now proceed to explaining some other frequently asked questions:
7. What is Liquidity?
Answer: Liquidity refers to how easily an asset or security can be bought or sold in the market without affecting its price. It indicates the level of supply and demand for that asset in the market.
It can be measured by the size of the spread.
Higher liquidity (which typically means narrow spreads) indicates that there are many buyers and sellers facilitating quick and smooth market executions. In other words, the more liquid an asset is, the faster and smoother the transactions can take place.
The narrowest trades are usually observed during peak forex market hours, when both European and the US markets open.
Conversely, low liquidity (which typically means wider spreads) can make trades difficult to execute and may lead to larger price fluctuations and slippage.
8. When does market illiquidity occur and why does it lead to the widening of spreads?
Answer: Market illiquidity occurs when there are not enough buyers and sellers readily available to trade an asset, making it difficult to buy or sell quickly without impacting the price. This lack of activity can stem from various factors such as news events, carrying large trades into the next day, trading during 22:00hrs – 23:00hrs UTC can lead to several negative consequences, including widening bid-ask spreads.
It is advisable to avoid trading during illiquidity or low liquidity.
You can also learn more by watching our video on bid/ask charts, spread and liquidity on YouTube
Summary (Key points):
Slippage:
- It is normal in forex trading.
- Usually caused by volatility, low liquidity, order size, etc.
- It can work for or against you.
- RebelsFunding has no control over slippage.
News Trading:
- Allowed, but not recommended for amateur traders.
- High risks: unexpected gaps, slippage, exceeding stop loss, exceeding drawdown.
- Avoid trading during high impact news events or high volatility periods.
Ask/Bid Chart:
- Unique feature on the RF-Trader platform (not common on other trading platforms).
- Bid chart – opens sell transactions, shows selling price.
- Ask chart – opens buy transactions, shows buying price.
- Switching between the ask/bid charts helps you view history of spreads.
Spread:
- Difference between ask and bid price.
- Represents trading costs and broker’s fee.
- View spread history by switching between Ask/Bid charts.
Other Points:
- Liquidity: higher liquidity means narrow spreads and easier transactions.
- Avoid trading during illiquidity or low liquidity (e.g., during high-impact news events or around 22:00–23:00 UTC).
Understanding slippage, news trading risks, and how to use the Ask/Bid charts is crucial for informed trading at RebelsFunding.
Prioritize proper risk management and avoid unnecessary risks.
Best wishes!
