Three Drives Pattern: How to Identify & Utilise it

The Three Drives pattern is a trading strategy used to find potential trend reversals.
It is made up of three consecutive price swings (also known as legs) in the same direction, and followed by a significant retracement.
In this post, we’ll look at how to identify and utilise it:
How to find the three drives pattern & trade it
1. Identify three successive swings: Observe your chart for a clear sequence of three upward or downward price movements. Each drive should go farther than the one it precedes.
2. Assign letters or numbers to each price point.
3. Measure fibonacci levels/ratios: Apply Fibonacci retracement & extension tools to the price points to determine if they reach or extend beyond key levels.
Ideally, all three price points (above and below) should meet at the same horizontal ratios.
4. Confirm pattern completion: Wait for the third leg to complete. Wait for it to get to an over-extended level.
When this happens, expect an exhaustion in the current trend and a high probability reversal.
What should you expect in a bullish three-drive pattern:
A potential reversal from a downtrend to an uptrend. Here’s the structure:
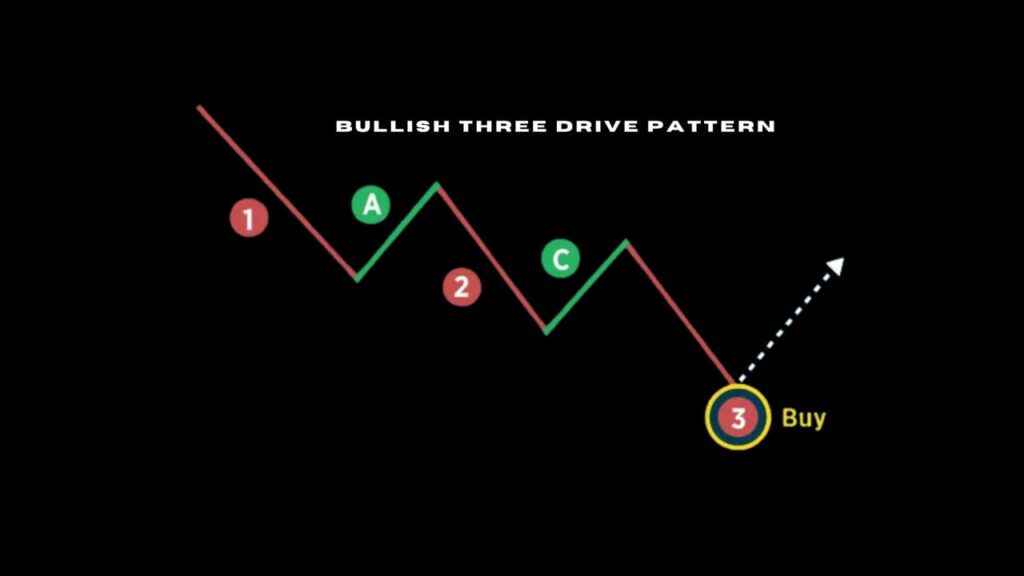
Drive 1 (D-1): A downward price movement.
D-A: Retracement of drive 1 to 61.8% or 78.6% fib retracement level.
D-2: A new downward movement is formed & extends beyond the previous low.
D-C: An upward movement is seen again, it gets to the same retracement level (61.8% or 78.6%.) as drive A.
D-3: Price falls again extending beyond drive 2.
Next drive, we speculate a strong upward movement that could extend beyond the previous high (drive C), and could reach higher fib extension levels.
(You can enter a buy position above the third drive.)
Bearish three-drive
For a bearish pattern, the market is expected to move down from an uptrend:
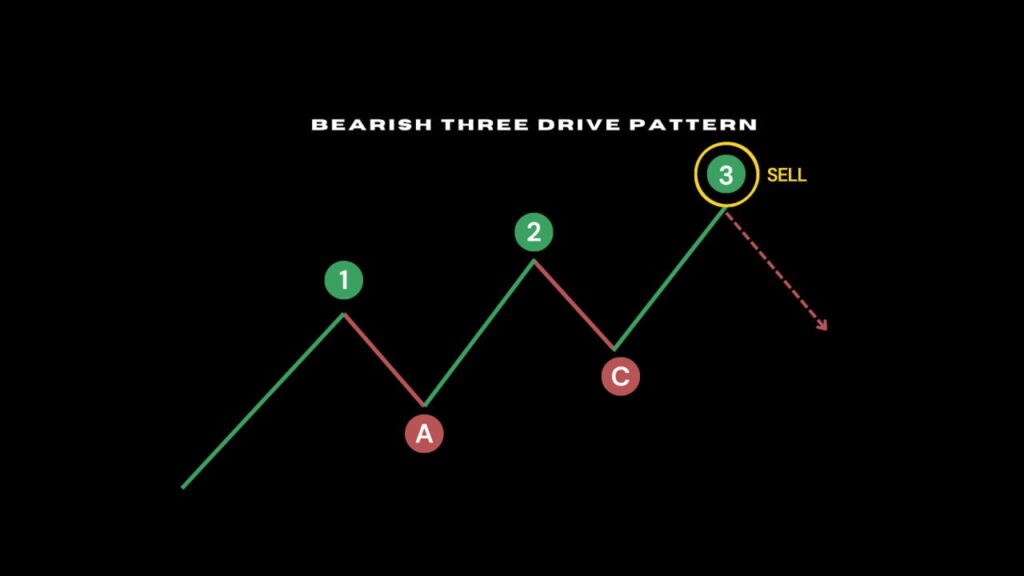
S-1 (Swing 1): Price goes up.
S-A: Price retraces to fib level 61.8% or 78.6%
S-2: Again, price pumps up. This time, it pushes beyond the previous high (Swing 1).
S-C: Swing C moves down to the same fib level as Swing A.
Swing 3: We see price shoot up again to the same fib extension level (1.272%) of Swing 1 & 2.
When all the three swings/drives have been confirmed, we can anticipate that the market would be going absolutely downward. And would likely pass the previous low (point C).
Enter a sell position below drive three.
This pattern works well with all time frames, and is most effective in a trending market.
It is recommended you pay attention to market conditions, your risk tolerance, and confirm your speculation with other indicators for increased chances of success.

Join our traders

In forex trading, to effectively anticipate future prices, you should understand the…

Successful forex funded trader, Matúš reveals strategies that led to his trading…

Let's compare and contrast some prop firms based in the Czech/Slovak Republics…